

LIST: Report shows best, worst California beaches for water quality
LOS ANGELES - Heal the Bay released its annual report ranking hundreds of beaches in California based on pollution.
The report from 2020 to 2021, assigns A-to-F letter grades for 500 California beaches based on levels of fecal-indicator bacterial pollution in the ocean measured by county health agencies, according to Heal the Bay.
The report showed 93% of California beaches had "excellent water quality" in the summer of 2020, and received an A or B grade. However, only 57% of California beaches had good or excellent grades during wet weather, which is worse than the average.
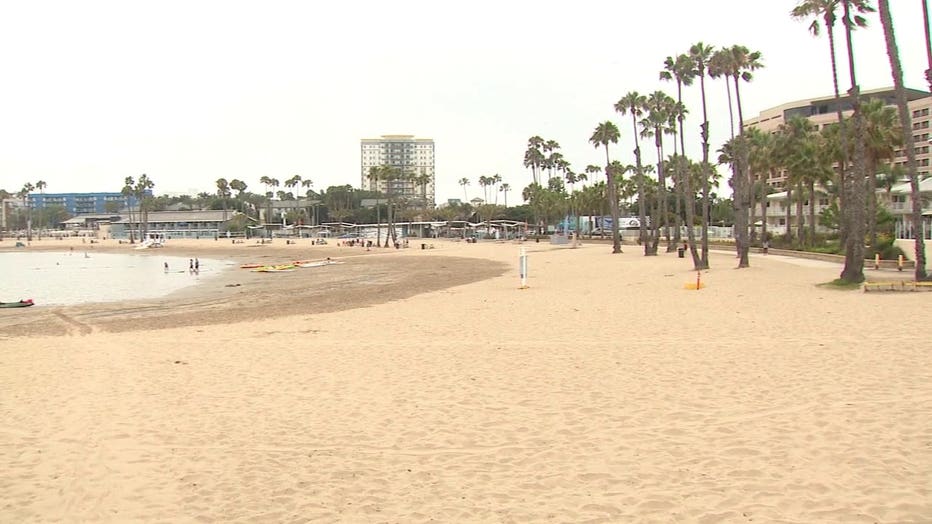
Mother's Beach in Marina del Rey ranked among the worst due to its poor water circulation.
The list of most polluted beaches from Heal the Bay includes the following:
- Tijuana Slough National Wildlife Refuge, Tijuana River mouth – San Diego County
- Foster City, Erckenbrack Park – San Mateo County
- Capitola Beach, west of jetty – Santa Cruz County
- Foster City, Gull Park – San Mateo County
- Marina del Rey Mother’s Beach, between Lifeguard Tower and Boat dock – Los Angeles County
- Tijuana Slough National Wildlife Refuge, 3/4 miles north of Tijuana River – San Diego County
- Clam Beach County Park at Strawberry Creek – Humboldt County
- Foster City, Marlin Park – San Mateo County; Candlestick Point, Windsurfer Circle – San Francisco County
- East Beach at Mission Creek – Santa Barbara County
Heal the Bay’s list of best beaches for water quality includes 35 California beaches that scored perfect water quality grades year-round, compared to 42 beaches in the prior year. Most beaches on the list are in Southern California because many counties in Central California and Northern California do not sample frequently enough during the winter months. Orange County had the most beaches on the list.
Get your top stories delivered daily! Sign up for FOX 11’s Fast 5 newsletter. And, get breaking news alerts in the FOX 11 News app. Download for iOS or Android.
The list includes the following:
1. Crown Beach, at Sunset Rd. – Alameda County
2. Royal Palms State Beach – Los Angeles County
3. Leo Carrillo Beach, at Arroyo Sequit Creek – Los Angeles County
4. Puerco State Beach, at creek mouth – Los Angeles County
5. Las Flores State Beach, at Las Flores Creek – Los Angeles County
6. Broad Beach, at Trancas Creek – Los Angeles County
7. Escondido State Beach, at Escondido Creek – Los Angeles County
8. Nicholas Beach, at San Nicholas Canyon Creek – Los Angeles County
9. Newport Bay, Promontory Point – Orange County
10. Crystal Cove (CSDOC) – Orange County
11. Newport Beach, at Orange Street – Orange County
12. Newport Beach, at 52nd/53rd Street – Orange County
13. Balboa Beach Pier – Orange County
14. Balboa Beach, The Wedge – Orange County
15. Crystal Cove – Orange County
16. 1000 Steps Beach, at 9th St. – Orange County
17. North Aliso County Beach – Orange County
18. Treasure Island Beach – Orange County
19. Carlsbad, at Encina Creek – San Diego County
20. Carlsbad, at Palomar Airport Rd. San Diego County
21. Solana Beach, Tide Beach Park at Solana Vista Dr. – San Diego County
22. Guadalupe Dunes – Santa Barbara County
23. El Capitan State Beach – Santa Barbara County
24. China Beach, at Sea Cliff Ave. – San Francisco County
25. Ocean Beach, at Lincoln Way – San Francisco County
26. Sewers at Silver Shoals Dr. – San Luis Obispo County
27. Morro Bay City Beach, at Atascadero – San Luis Obispo County
28. Pismo State Beach, 330 yards north of Pier Ave. – San Luis Obispo County
29. Hollywood Beach, at Los Robles St. – Ventura County
30. C.I. Harbor, at Hobie Beach Lakeshore Dr. – Ventura County
31. Oil Piers Beach, south of storm drain – Ventura County
32. Silverstrand, at Sawtelle Ave. – Ventura County
33. Ormond Beach, 50 yards north of Oxnard Industrial drain – Ventura County
34. Ormond Beach, at Arnold Rd. – Ventura County
35. Faria County Park, at stairs – Ventura County
The report is endorsed by The State Water Resources Control Board.